Ericsson
Ericsson UDN: Revolutionizing content delivery
Desktop web
In 2015, while working at Idean (now frog.co), I worked on the design and development of the Ericsson Unified Delivery Network (UDN) platform, launched in Barcelona at the 2016 Mobile World Congress. The UDN platform aimed to revolutionize digital content delivery by providing a more efficient, scalable, and user-friendly solution for delivering rich media content globally. Content providers were able to connect with service providers in the “last-stretch” of content delivery, while service providers can configure their networks appropriately to deliver content appropriately.
My role
Design, development, user research, design systems, MVP, enterprise
Team
1-2 PMs, 2-3 designers, 2-3 engineers
Timeline
2015 - 2016
Overview
Problem
The previous UDN platform was overly complex to use, lacked efficient data exploration and analysis tools, and a long onboarding process, resulting in a poor experience for both content and service providers, and high-operating costs with a significant loss in potential revenue.
Goal
Develop a new UDN platform that was intuitive and easy to use and on-board with robust data analysis tools, resulting in reduced latency and faster performance, enhanced scalability with minimal delivery interruptions, and lowered operational costs.
Context
How a UDN works
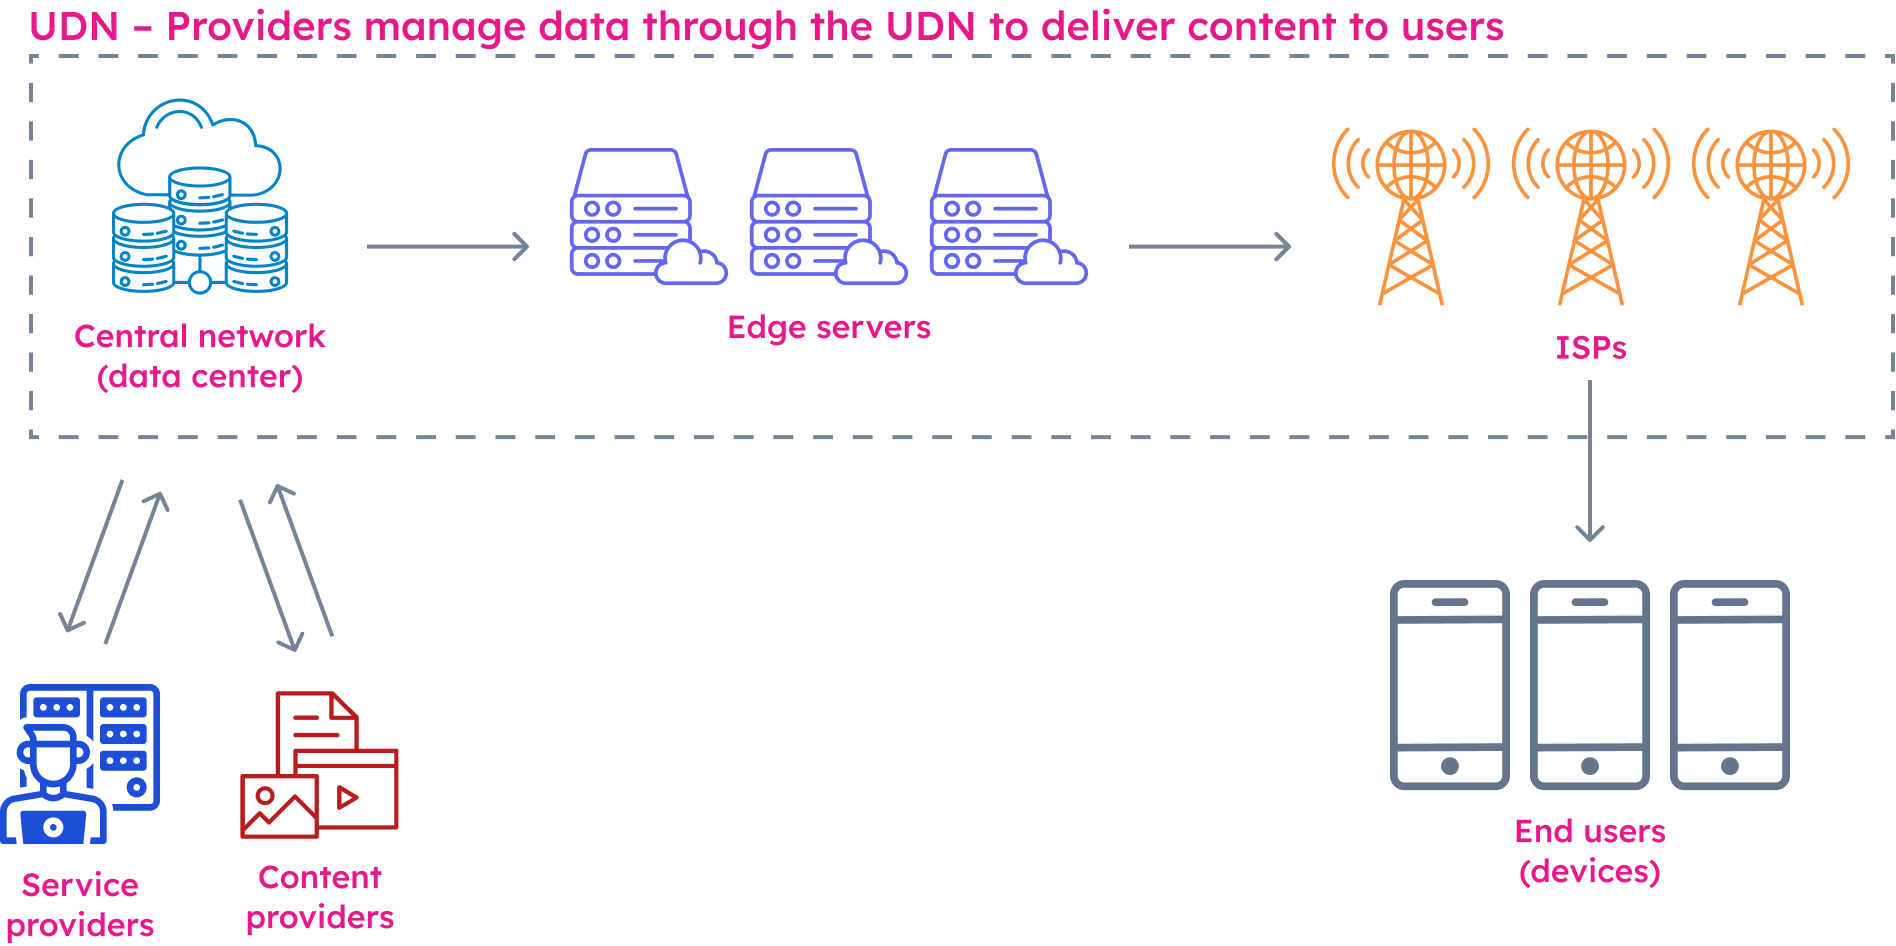
A Unified Delivery Network (UDN) is a next-generation content delivery network that uses edge computing to minimize latency and accelerate content delivery to its intended audience by bridging the gap between content providers and service providers, through supporting both roles:
- Content providers (CPs): Companies and individuals who create and distribute digital content (videos, images, etc.) globally using UDN tools to manage traffic, target audiences and policy rules, and optimize delivery speed.
- Service providers (SPs): Manage and maintain the delivery network infrastructure, optimizing content delivery through analytics, caching strategies, and network performance control.
- End users: Consumers who access the content delivered through the UDN, whose satisfaction indicates the platform’s success.
CPs upload their media to the platform for processing and optimization, , which is then routed through a network of servers, managed by SPs, closer to the end user. By leveraging advanced caching techniques and real-time analytics, the UDN ensures that content is delivered efficiently, reducing the load on individual networks and faster performance with minimal interruptions.
Solutions
Intuitive dashboard for service providers
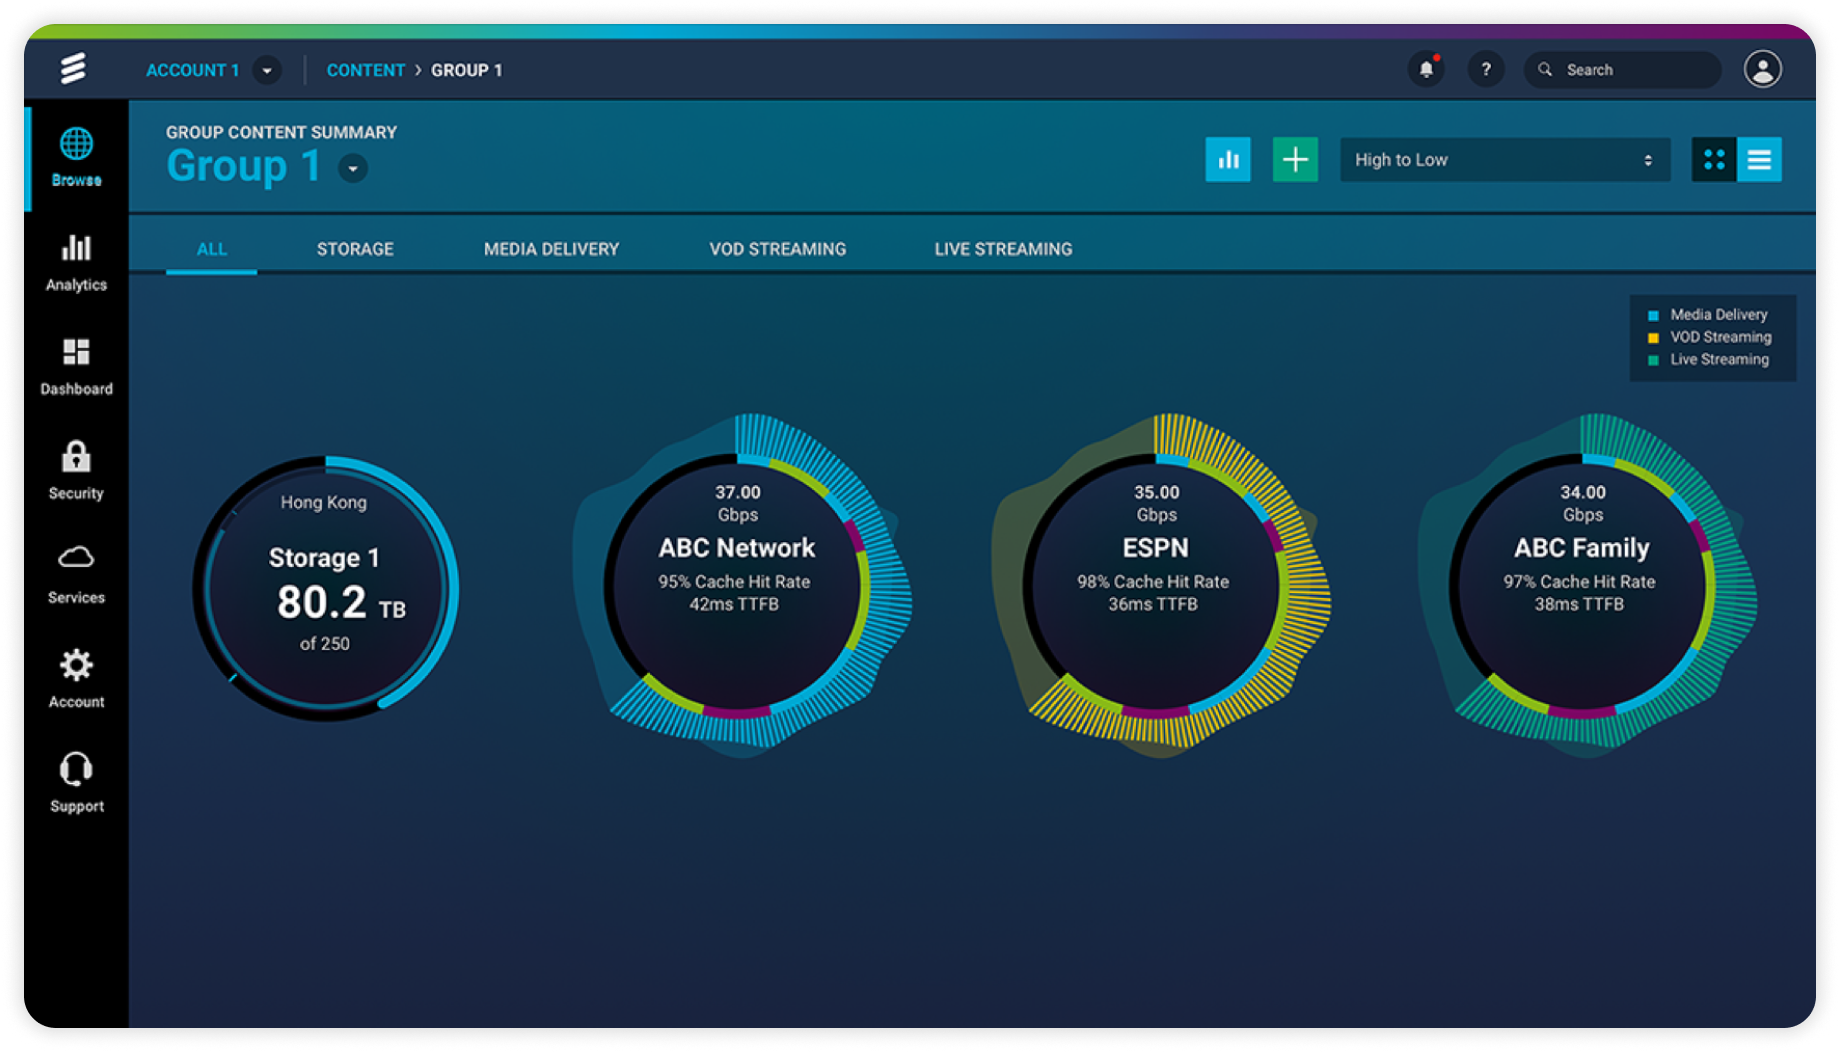
To meet the needs of service providers, we designed a user-friendly dashboard that offers a comprehensive, at-a-glance view of network performance metrics for each managed content group, with the ability to analyze deeper through interacting with it. The dashboard features innovative circular "starburst" graphs that instantly analyze and visualize data traffic usage, cache rates, and time-to-first-byte (TTFB) over the past and current month. Trends and content types are color-coded for easy interpretation. Service providers can quickly identify bottlenecks, analyze data traffic, and make informed decisions to optimize their network configurations. This visualization tool simplifies the monitoring process and empowers service providers to enhance the efficiency and reliability of their content delivery networks.
SERVICE PROVIDER DASHBOARD
The “starburst” graphs above allow service providers to instantly have an overview about how a content group is performing with relevant traffic usage data and performance metrics, with the ability to drill deeper for more detailed analyses.Comprehensive traffic management for content providers
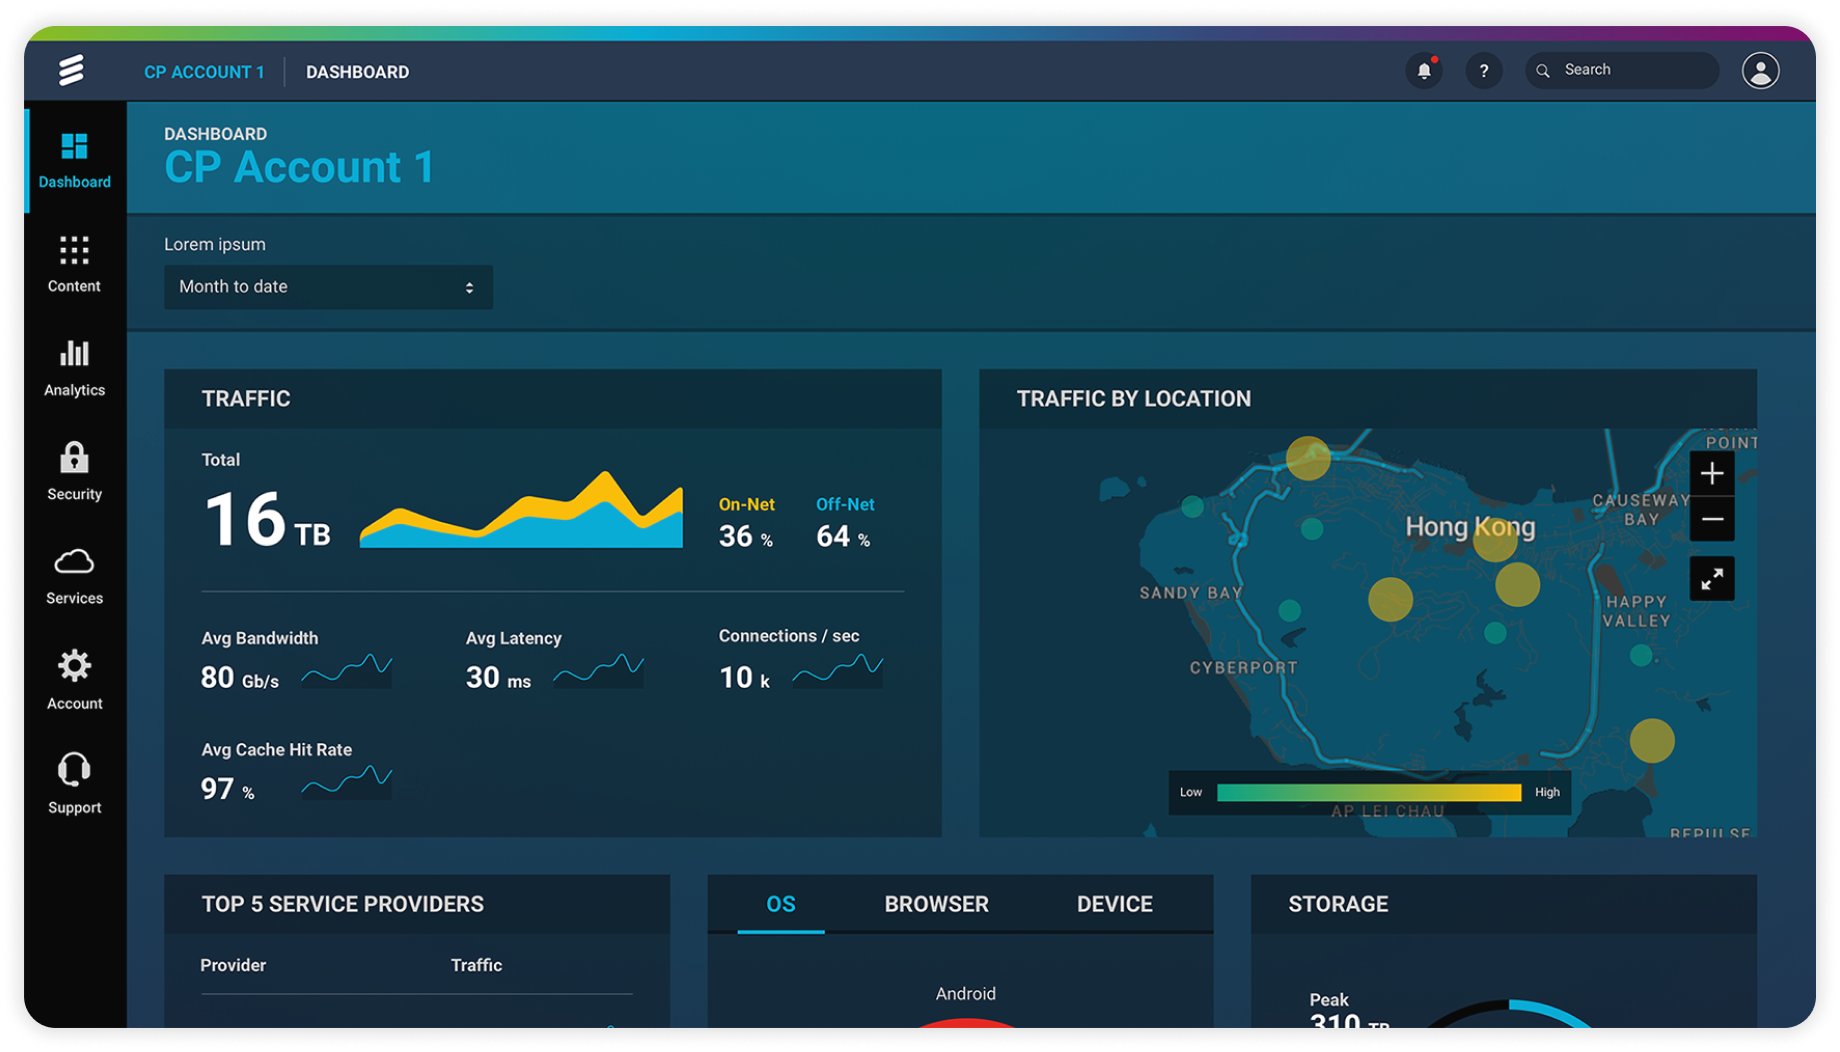
For content providers, we introduced a traffic management dashboard to monitor and manage overall traffic. The dashboard displays information such as bandwidth, latency, and cache hit rates, segmented by location, service providers, and devices. This detailed view helps content providers optimize delivery strategies by identifying high-traffic areas and adjusting content distribution to the intended audiences accordingly. By providing this level of granularity, content providers can maximize their reach and engagement.
CONTENT PROVIDER DASHBOARD
Content providers can manage traffic through their dashboard, to monitor and optimize content delivery.Flexible configuration forms for customizing delivery
In addition to the management dashboards, we designed flexible configuration forms to facilitate various settings adjustments. These forms allow content providers to easily customize their delivery parameters. For example, the content targeting and policy configuration form lets providers set delivery rules based on criteria like geographic location, device type, and user behavior. By making the forms intuitive and accessible, we ensured that content providers can swiftly adapt their configurations to meet evolving needs.
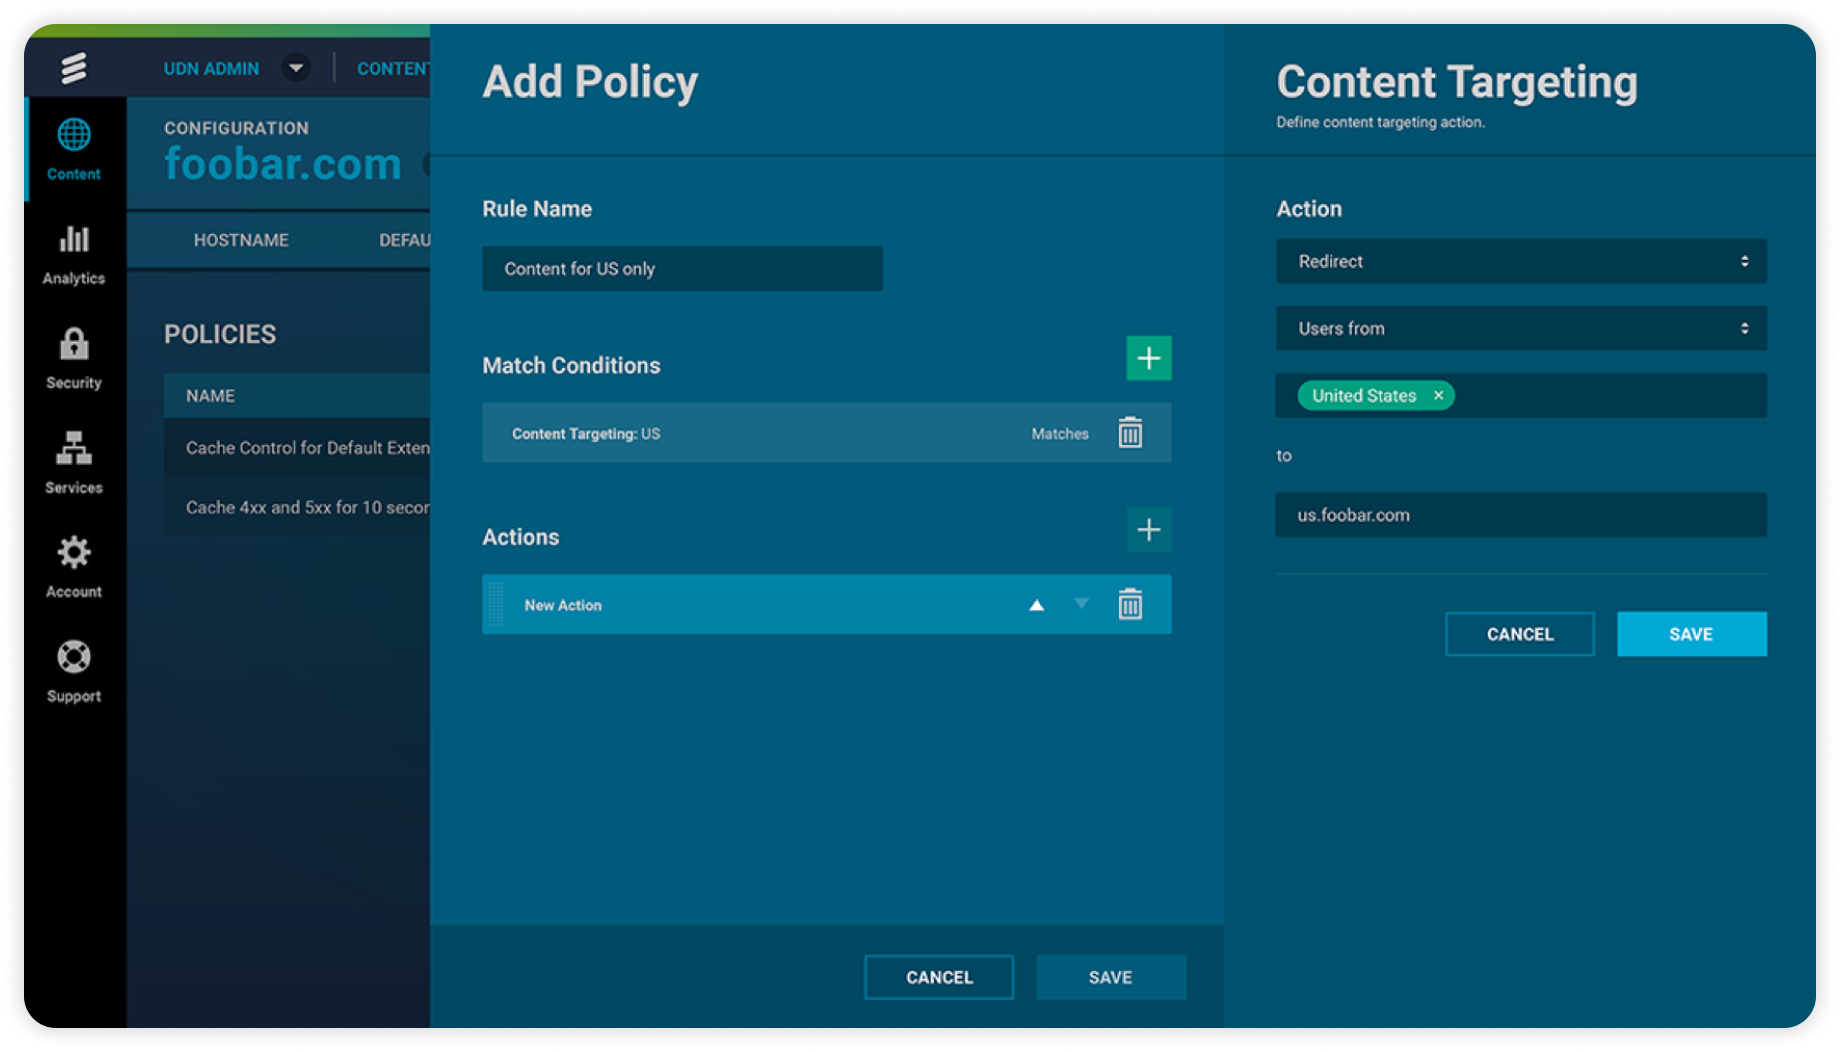
CONTENT CONFIGURATION FORMS
Through these newly-designed forms, content providers can customize their content targeting and policy configuration rules.Outcomes
Impact
Reduced on-boarding time for content and service providers by ~50%, increased performance for faster content delivery by decreasing latency by ~30%, and lowered operational costs by optimizing delivery processes by ~20%